WAHA, Uptime Kuma & Grafana Operations Stack
A self-hosted monitoring and alerting stack that connects service health, dashboards, application errors, and WhatsApp incident notifications.
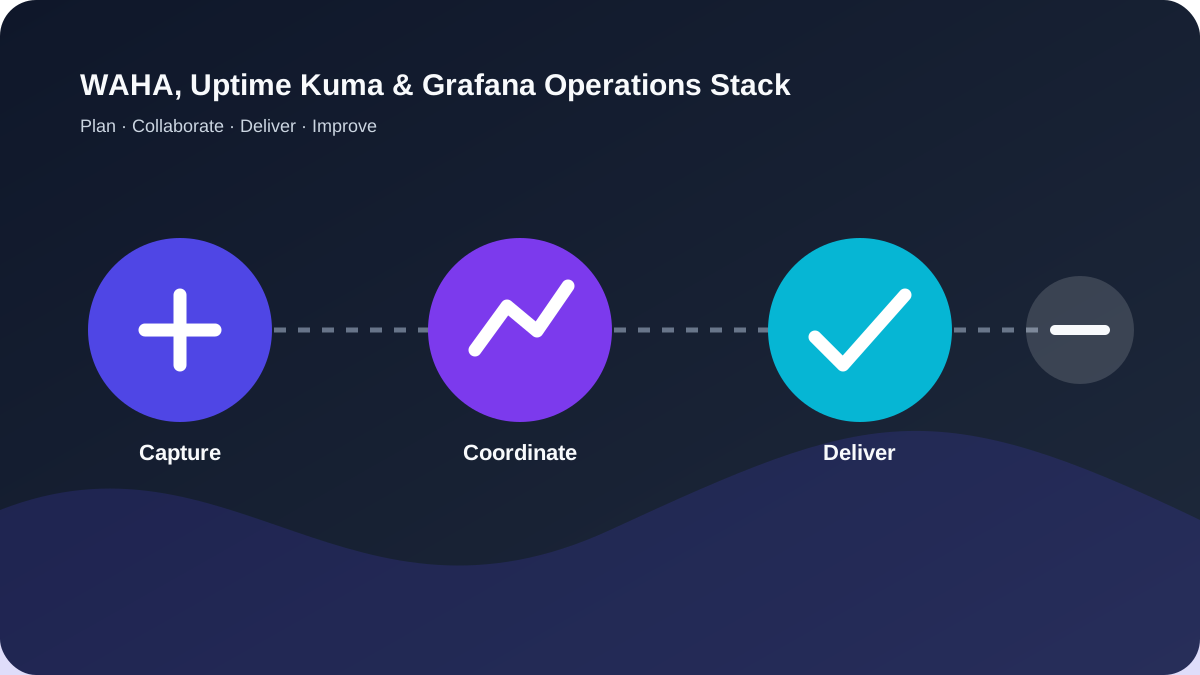
Configured and integrated a practical operations stack for VPS-hosted applications using WAHA, Uptime Kuma, Grafana, containerized services, and web application notification hooks. The solution provides uptime checks, operational dashboards, WhatsApp alerts, recovery notifications, and repeatable incident-response workflows.
Selected capabilities
- WAHA WhatsApp session and webhook setup
- Uptime Kuma monitors and status pages
- Grafana dashboards and operational metrics
- Docker and Ubuntu VPS deployment
- Alert escalation, recovery, and maintenance flows
Outcomes
- Faster awareness of downtime and application errors
- Central visibility across multiple hosted applications
- Lower-cost alert delivery through self-hosted components
- Reusable monitoring pattern for future deployments
Implementation notes:
WAHA · WhatsApp Web API · Uptime Kuma · Grafana · Prometheus-compatible metrics · Docker · Ubuntu VPS · CloudPanel · Laravel notifications
· Readiness 65%